Amazon Listing Images: How to Optimize Image Order for Higher Conversions
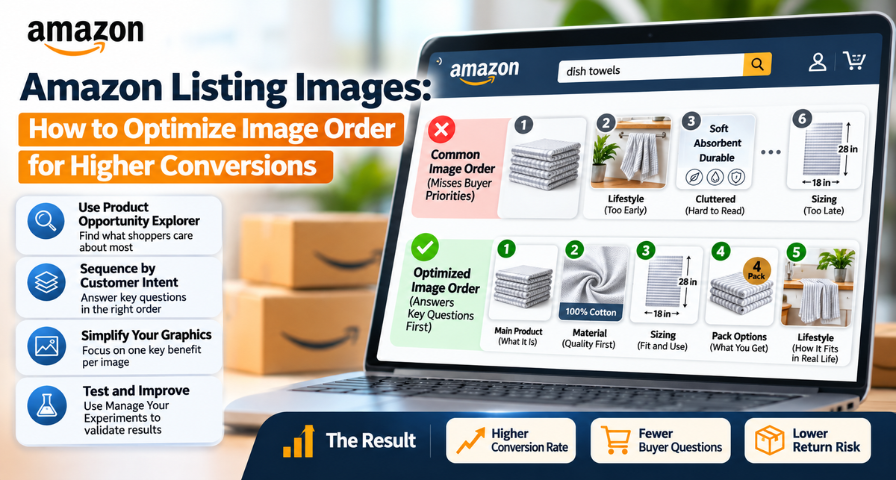
Sellers usually regard their product images as a photo album. They pick up the best ones, throw some infographics in there, and arrange everything out of pure intuition or whatever the designer has come up with. It sounds logical, and it costs you sales on a daily basis.
This is the concept worth considering carefully. Visitors of your listing page, especially Amazon Prime users, are usually looking for a product to buy. In one of his recent presentations, Anthony Cofrancesco – Amazon seller and consultant, experienced eight-year Amazon seller and former employee of PickFu and Data Dive – mentioned an estimation of about 74% of conversion among Prime users. This is just a rough estimation based on one presentation rather than an exact Amazon conversion rate. The conversion rate depends on the price, reviews, source of traffic, and visitor's intentions. Nevertheless, the principle is the same: a person wants something within your product category, and the competition is who manages to get the click. Your Amazon listing images are part of this competition, as they either answer all the questions of the visitor or don't.
Why Image Order Matters More Than Image Quality
Consider the true experience of browsing on a mobile device: someone walking the dog, watching over a toddler, or swiping on their coffee break. They flick through your gallery at a rapid pace, giving a second or two to each picture.
Given that reality, the beautiful picture that is out of place will have less value than an average graphic in its rightful place. If the consumer's immediate concern is whether the materials are decent at all, and your second picture features a happy family at the picnic table, you have wasted precious space on nothing. The time when the materials description appears on the sixth image, they are either off and gone or no longer interested.
That is why Amazon image optimization is better seen as a sequencing issue rather than a creative one. The point is not to create an impressive image every single time. The point is to have every image do some job. The listing that covers all the buyer’s concerns in the buyer’s order comes as a logical and obvious choice, while another one turns into a hunt.
Use Product Opportunity Explorer to Find Customer Priorities
What makes any sequencing problem tricky is establishing the right sequence, but Amazon provides a powerful hint from the start. In the Seller Central interface, go to the Growth menu and click on the Product Opportunity Explorer. Input your target keyword and scroll down to the Key Success Attributes, which show you the main features that shoppers within that particular niche seem to be looking for, based on Amazon’s own research.
A clarification matters here. Amazon does not tell you which exact image belongs in position two or three. What it gives you is insight into customer priorities, and translating those priorities into a gallery sequence is your interpretation. That is still valuable, because you are working from marketplace data and not from a hunch.
Using the example of dish towels, Amazon determined that in order of importance the key success attributes were material quality, sizing, and packs. This implies a logical sequence: the second image proves the material, the third the sizing, and the fourth the contents of the pack. How does this compare to your own listing? In most cases, your sizing image will be placed way down in the sixth slot, material close-up not even created, and the second image will be a lifestyle image that does not answer anyone's question.
Build Your Image Sequence Around Customer Intent
Once the hierarchy is established, the order practically writes itself. Let’s consider a more competitive item like diabetic socks. Assume that your research and consumer feedback reveal that the customer values material quality, sizing, and a comfy, non-binding cuff.
The first image remains the same as the primary one, as it has to speak for the product itself. The second can display the material, as customers who may have sensitive skin will be interested in what material comes into contact with their foot. The third image will address shoe-size compatibility, as this is one of the primary concerns. The fourth image can feature the construction of the cuff and tell why the sock is not binding. The fifth image can reveal the cushioning; the sixth one – the way how the product can be used in everyday life, and the seventh one – the pack quantity and colors.
See how the lifestyle image has not vanished but simply changed its place in the lineup. Every image in this row has answered a particular customer’s question.
Break Up the Overcrowded Feature Graphic
With the order fixed, look for your busiest image. Every seller has one: the graphic that says soft, absorbent, gentle, durable, and machine washable all at once, squeezed in with four icons and a block of tiny text.
The instinct is understandable. You have limited slots and a lot to say. But density works against you with distracted shoppers. Nobody studies a wall of text on a phone while doing something else, and the message that matters most gets lost among the ones that matter less.
The fix is to let one point own the whole image, ideally the top attribute from your research. If you use an AI tool like ChatGPT or Gemini for the design, a prompt in the spirit of Cofrancesco’s works well. Ask it to create a single feature graphic for your product focused only on one named feature, with the product on the left, a large-text callout on the right with a two-sentence description, and a clean, minimal layout with generous white space. The phrase “only” is doing the real work, because it stops the tool from drifting back toward clutter.
If several graphics are overloaded, replace them one at a time. That way you learn which simplification actually helped.
Find Missing Image Types Through Competitor Research
The third move is about what is missing entirely. According to Cofrancesco, images on Amazon fall into roughly eighteen recognizable types. Anatomy graphics use arrows and callouts to explain a product’s parts. Sizing graphics place the item beside something familiar, like a coffee mug, so scale is instantly clear. Application grids show several uses side by side. Comparison charts set your product against a generic alternative, and how-to graphics walk through steps.
In order to discover your gaps, make screenshots of the secondary images of your top five or ten competitors and identify them by type. Afterward, do your math. Every type used in 40% or more of your listings is expected to be seen by your customers, and if such a type is missing from your set, then you have discovered a gap. The most frequent types turn out to be the simplest possible: an anatomy graphic is not provided, so customers cannot learn about product structure, and a sizing graphic is missing because it forces customers to guess and return products along with their complains about the size.
One important thing to remember. Some types used by your competitors can simply be disregarded. Amazon guidelines ban customer review images and rating star images in product images, so testimonial graphics can bring your listing to trouble. Stay on the safe side and use only those types that promote your product.
Mine Reviews and Returns for Visual Gaps
Product Opportunity Explorer provides the niche context. Your customers explain what your product is, and they are often very frank about it. Analyze your reviews and return explanations through one question: What didn't the buyer understand when he bought it?
If buyers consistently comment on how the socks are sized too small, it might be worth including shoe size in your gallery images. If buyers have trouble judging the thickness of the socks, a close-up of the knitted material can solve this issue before the return happens. If the buyers are surprised at what they got in the package, the gallery image of the contents needs to be more informative.
A combination of all three sources is the best solution to the problem: Product Opportunity Explorer tells you about the niche priorities, customer reviews, and customer reviews. Insights tell you about the product-specific misunderstanding, and competitor galleries provide visual templates familiar to customers. The intersection of three sources proves your image needs to be made.
Why Mobile-First Image Design Matters for Amazon Conversion
The majority of buyers on Amazon browse from mobile devices, so assess your visuals on mobile devices. Display your product listing on the tiniest device that you have access to and examine each visual for two seconds. Are you able to understand what the image is all about?
Little typefaces, lengthy series of icons, and complicated diagrams that appear clear and sharp on your computer could be distracting on your mobile device. Each visual must convey its message within split seconds, employ legible type that does not require magnification, and contain no elements that do not support that message. It’s exactly the concept of the single feature graphics applied on an overall level. If the visual requires more than a few sentences to be understood, it is doing too much.
Test Your Images With Manage Your Experiments
Reordering images and watching your numbers is a reasonable first check, but it is not a true A/B test. Imagine you move an image on November 1 and the next two weeks overlap with a big shopping event. Conversion might rise even if the image made no difference.
A stronger option is Amazon’s Manage Your Experiments, available to eligible brand owners. It randomly splits shoppers into groups and shows each group a different version of your content, so seasonality and promotions affect both versions equally. Amazon’s guidance suggests letting experiments run until there is enough data to reach a meaningful result, which can take four weeks or longer depending on traffic.
A tidy workflow looks like this. Research your customers’ priorities, audit your current gallery, and form one hypothesis, such as “moving the sizing graphic earlier will improve conversion.” Run it as an experiment, and implement the winner only after the result is clear. If your product is not eligible, the manual method still works as a rough guide, provided you change one thing at a time, keep advertising steady, and note any outside events.
Check the Live Page and Read the Data Honestly
Before you celebrate any result, confirm that shoppers actually see what you uploaded. Amazon’s product image guidance notes that submitted images are not guaranteed to appear, and that the platform can select and arrange images to create a good customer experience. After every change, view the live detail page on both desktop and mobile and check that your intended sequence is what appears.
Then read your conversion numbers with some humility. Strong images cannot rescue a weak price, poor reviews, or a real quality problem. They reduce friction and convert interest that already exists. Keep a simple log of each change, its date, and its result, and over a few months you will have a playbook specific to your niche, which is worth more than any generic advice about what good images look like.
Stop Guessing and Start Optimizing
The central lesson is that you do not have to guess what shoppers want to see first. Product Opportunity Explorer gives you a clue about their priorities, your reviews show you their confusion, and competitor galleries show you which formats they already expect. Your job is to turn those signals into a gallery where every image is useful and the order feels natural.
If you have fifteen minutes today, spend them on the first step. Pull up your Key Success Attributes, compare them with your current image order, and move one image. Then test it properly, check the live page, and let the data speak. Sellers who work this way are not winning with bigger budgets or flashier design. They are simply paying attention to the order in which buyers think.
Ready to Grow on Amazon?
Let our experts help you scale your Amazon business with proven strategies.
Get a Free Consultation
Comments (0)
Leave a Comment